
UPSC CSE Prelims cut-offs have moved 40+ marks across a decade for some categories — three distinct regimes that map cleanly to UPSC's structural changes. The 10-year category-wise trend (UR / OBC / SC / ST / EWS / PwBD), the inflection points, and what the data suggests for the 2026 cut-off after the 24 May paper.
Most UPSC content circulating online treats cut-offs as a single number — usually the previous cycle's UR figure, which gets quoted as if it were a permanent threshold. It isn't.
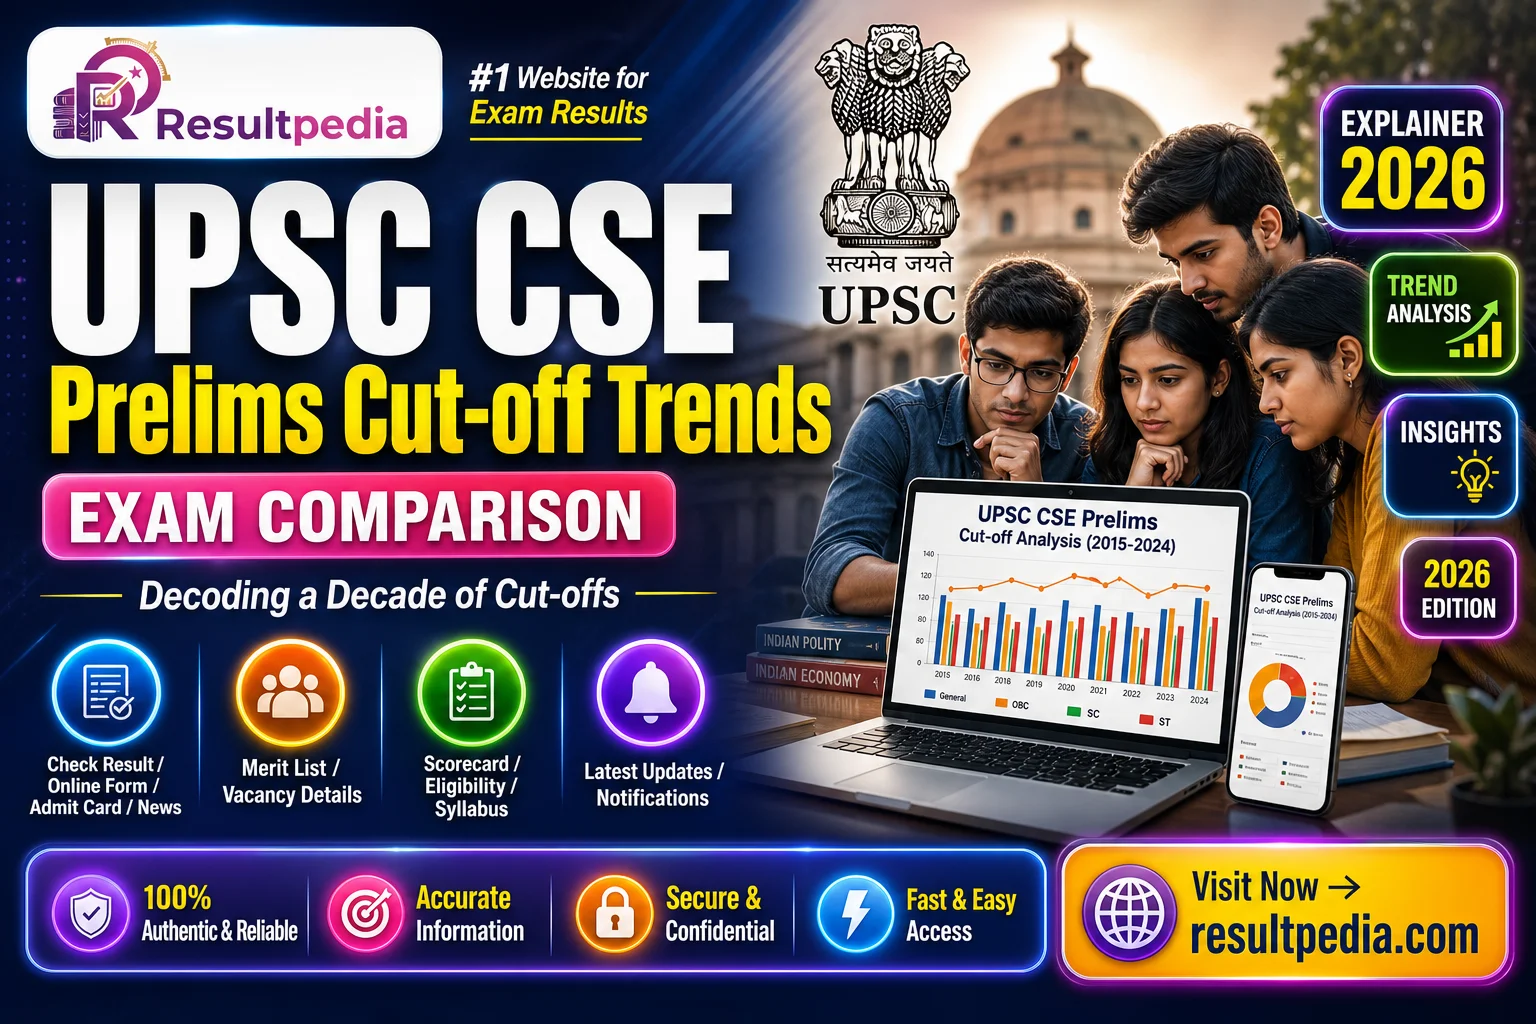
This is the 10-year category-wise cut-off trend for UPSC CSE Prelims (General Studies Paper-I, scored on 200). What the data shows: the cut-off has moved by 40+ marks across the decade for some categories, with three distinct regimes that map cleanly to UPSC's structural changes.
If you are calibrating a target score for CSE 2026 Prelims on 24 May, the right reference isn't 2024's number alone. It's the trend that produced 2024's number, and what that trend suggests for the cycle you're competing in.
Why this matters more than aspirants realise. A 2026 aspirant aiming for "the 2024 cut-off + 5 marks" is using a single data point as a guide. The 10-year trend tells you the standard deviation of cut-offs across cycles — and that standard deviation is the actual safety buffer you need to plan for, not a single previous-cycle figure.
The 10-year cut-off table — UPSC CSE Prelims GS Paper-I
All figures are out of 200 marks. Source: official UPSC cut-off documents released after Personality Test results in each respective cycle.
| Cycle | UR | OBC | SC | ST | EWS | PwBD-1 | PwBD-2 | PwBD-3 | Notification | Vacancy |
|---|---|---|---|---|---|---|---|---|---|---|
| 2015 | 107.34 | 106.00 | 94.00 | 91.34 | — | — | — | — | May 2015 | 1,164 |
| 2016 | 116.00 | 110.66 | 99.34 | 96.00 | — | — | — | — | Apr 2016 | 1,079 |
| 2017 | 105.34 | 102.66 | 88.66 | 88.66 | — | — | — | — | Feb 2017 | 980 |
| 2018 | 98.00 | 96.66 | 84.00 | 83.34 | — | — | — | — | Feb 2018 | 782 |
| 2019 | 98.00 | 95.34 | 82.00 | 77.34 | 90.00 | 53.34 | 44.66 | 40.00 | Feb 2019 | 896 |
| 2020 | 92.51 | 89.12 | 74.84 | 68.71 | 77.55 | 70.06 | 63.94 | 40.82 | Feb 2020 | 796 |
| 2021 | 87.54 | 84.85 | 75.41 | 70.71 | 80.14 | 68.02 | 67.34 | 43.00 | Mar 2021 | 712 |
| 2022 | 88.22 | 87.54 | 74.08 | 69.35 | 82.83 | 68.02 | 56.66 | 51.34 | Feb 2022 | 1,022 |
| 2023 | 75.41 | 68.02 | 59.25 | 47.82 | 68.02 | 40.40 | 47.13 | 40.40 | Feb 2023 | 1,105 |
| 2024 | 87.34 | 81.95 | 75.00 | 70.55 | 78.54 | 65.34 | 47.82 | 40.40 | Feb 2024 | 1,056 |
| 2025 | 87+ | 80+ | 73+ | 69+ | 78+ | — | — | — | Jan 2025 | 979 |
| 2026 | Awaited (July 2026) | — | — | — | — | — | — | — | Feb 2026 | 933 |
Notes on the table:
- EWS category was introduced post-103rd Constitutional Amendment in 2019. No EWS cut-off exists for cycles before 2019.
- PwBD subcategories (PwBD-1 visual, PwBD-2 hearing, PwBD-3 locomotor + multiple) were broken out as separate cut-off lines from 2019. Pre-2019, PwBD reservation was applied to a single combined category.
- 2025 figures in italics are approximate — declared by UPSC in August 2025 with the CSE 2025 Mains call list. For the precise 2025 PDF, refer directly to the UPSC archive on upsc.gov.in.
- 2026 figures publish in July 2026 alongside the Mains call list. This article will be updated.
The four regimes visible in the data
The 10-year sequence isn't a smooth line. It breaks into four distinct phases, each driven by a structural cause.
Regime 1 — Pre-CSAT-stabilisation (2015–2017): high baseline
UR cut-offs ran 105–116 during this period. The reason is structural: CSAT (the Paper-II qualifying-only paper introduced in 2011) was still being calibrated as a true qualifier. Many candidates who would have been screened out by today's CSAT difficulty made it through, expanding the post-Prelims candidate pool and pushing GS-I cut-offs up.
In 2016 specifically, the UR cut-off hit a decadal peak of 116.00 — driven by an unusually easy GS-I paper that year combined with high vacancy (1,079) attracting strong applicants.
Regime 2 — CSAT settles in (2018–2020): structural drop
UR cut-offs dropped to 92–98 as CSAT difficulty stabilised at a level that genuinely screened out 30–40% of candidates. The Prelims pool shrank to a more competitive set, and GS-I cut-offs naturally compressed.
The introduction of EWS in 2019 added a fifth category but didn't materially shift the UR / OBC / SC / ST scoring distribution — EWS reservation came from the existing UR pool rather than expanding the merit pool.
Regime 3 — Low-band equilibrium (2021–2022): the 87–88 plateau
UR cut-offs found a 2-year plateau at 87–88. By this point CSAT was fully calibrated, applicant volume had stabilised at ~6 lakh appearing, and vacancy was in the 712–1,022 band. The arithmetic of "6 lakh appearing, ~13,000 cleared, ~1,000 vacancies" produced a stable equilibrium cut-off.
Aspirants who built their target around this regime started planning for the 87–90 range as the "new normal."
Regime 4 — Vacancy-trend pressure (2023–2024–2026): volatility returns
2023 broke the equilibrium downward — UR fell to 75.41, the lowest of the decade. The proximate cause: a markedly tougher GS-I paper combined with the highest vacancy of the period (1,105). Top-end candidates didn't clear at the 87+ band; the merit pool shifted lower.
2024 corrected upward — UR rebounded to 87.34. Vacancy dropped to 1,056 (4.4% lower than 2023), and GS-I difficulty returned to a calibrated level.
2025 held near the 87 band — the call list cut-off ran in the 87–90 range with vacancy dropping to 979.
2026 is the cycle currently in play. Vacancy is at a 5-year low (933). With stable applicant volume, the cut-off math says: expect UR Prelims cut-off in the 90–93 range for the cycle whose Prelims paper falls on 24 May 2026. This forecast assumes standard difficulty — a markedly easier paper would push this higher; a markedly harder paper (like 2023) could compress it back to the 80s.
Category-specific pattern observations
UR–OBC gap is narrowing
The gap between UR and OBC cut-offs has compressed across the decade:
| Cycle | UR–OBC gap |
|---|---|
| 2015 | 1.34 marks |
| 2018 | 1.34 marks |
| 2020 | 3.39 marks |
| 2023 | 7.39 marks |
| 2024 | 5.39 marks |
The widening 2020–2023 reflects shifting applicant-pool composition (OBC representation in top-scorer band rose). The 2024 partial reversion suggests this is finding a new equilibrium around 5–7 marks rather than the pre-2018 ~1-mark difference.
For OBC aspirants: historically you targeted "UR cut-off minus 1 mark." Today the realistic target is UR cut-off minus 5–6 marks. That's still tight competition; just less symmetrical with UR than the 2015-era pattern suggested.
SC–UR gap is stable
SC cut-offs have consistently run 12–18 marks below UR across the decade with only minor variation:
| Cycle | SC–UR gap |
|---|---|
| 2015 | 13.34 marks |
| 2020 | 17.67 marks |
| 2024 | 12.34 marks |
The gap doesn't show a directional trend — it fluctuates within a narrow band tied to GS-I difficulty in each year. Aspirants in the SC category can target UR-target minus 13–15 marks as a stable working assumption.
ST gap is widening (after 2018)
ST cut-offs have moved further below UR over time:
| Cycle | ST–UR gap |
|---|---|
| 2015 | 16.00 marks |
| 2019 | 20.66 marks |
| 2023 | 27.59 marks |
| 2024 | 16.79 marks |
The 2023 spike was a single-cycle anomaly; the long-term trend is closer to 17–22 marks gap, which is wider than the SC category's gap. Aspirants in the ST category should target UR-target minus 17–22 marks.
EWS settled near OBC after introduction
Post-2019, EWS cut-offs have tracked 2–8 marks below OBC in most cycles, with the gap closing over time:
| Cycle | EWS–OBC gap |
|---|---|
| 2019 | -5.34 (EWS higher than OBC) |
| 2020 | -11.57 |
| 2021 | -4.71 |
| 2022 | -4.71 |
| 2023 | 0.00 (identical) |
| 2024 | -3.41 |
EWS aspirants should target ~OBC-equivalent score, with the recent 2-3 mark cushion being narrower than aspirants often assume from older 2019–2020 data.
What the trend tells us about CSE 2026
Working forecast for CSE 2026 Prelims cut-offs (published here for the record; will be verified against the official UPSC release in July 2026):
| Category | 2024 actual | 2026 forecast band | Logic |
|---|---|---|---|
| UR | 87.34 | 90 – 93 | 4.7% lower vacancy than 2025; tightening merit pool |
| OBC | 81.95 | 84 – 87 | UR–OBC gap of 5–6 marks holds |
| SC | 75.00 | 77 – 81 | Stable 12–14 mark gap below UR |
| ST | 70.55 | 72 – 76 | 17–20 mark gap below UR |
| EWS | 78.54 | 80 – 83 | OBC-minus-3 pattern |
The forecast is illustrative. Actual cut-offs depend on the exam-day GS-I difficulty (a 2023-style tough paper could compress UR to 78–82; a 2024-style standard paper produces 90–93; a 2018-style easy paper could push UR above 95).
The aspirant's correct calibration target: plan to score the upper bound of your category's forecast plus 5 marks. For UR aspirants, that's 98+ on Paper-I. For OBC, 92+. The 5-mark buffer absorbs (a) the standard deviation across cycles, (b) the answer-key-revision risk of 2-3 marks adjustment after re-evaluation, and (c) the genuine uncertainty in a single-day exam.
What drives cut-off movement (the real causal picture)
After staring at the table for a while, the actual drivers of cut-off movement become clear:
-
Vacancy count (largest single driver). A 10% lower vacancy with stable applicant volume pushes cut-offs up by roughly 2–3 marks. The 933-vacancy CSE 2026 cycle is 11.6% below 2023's 1,105 — translating to an expected 3–4 mark cut-off rise vs 2023 baseline.
-
GS-I difficulty (cycle-specific). An easier paper means more candidates score in the 90+ band, pushing cut-offs up. A harder paper (like 2023) compresses the top band and drops the cut-off. This is the most volatile driver; impossible to forecast pre-exam.
-
CSAT calibration drift. The pool of candidates who clear CSAT (the qualifying paper) varies year-to-year. When CSAT is unusually tough, the post-CSAT pool shrinks and GS-I cut-offs drop fractionally. When CSAT is easy, the post-qualifier pool is larger and cut-offs rise.
-
Applicant maturity. The "average" applicant 10 years ago was a less-experienced first-attempt aspirant. Today's pool has a higher proportion of repeat aspirants on attempt 3+, which shifts cut-offs slightly upward over multi-year horizons. This is the slow-moving structural component.
The often-cited drivers — coaching access, digital learning resources, current-affairs availability — have effects, but they're absorbed into the "applicant maturity" component above. None individually moves cut-offs more than 2–3 marks.
Comparing Prelims cut-offs to Mains and Final
A common error is conflating "Prelims cut-off" with "Mains cut-off" or "Final cut-off." They're three different selection rounds with different mathematics.
| Stage | Recent UR cut-off (CSE 2024) | What it represents |
|---|---|---|
| Prelims (GS-I, 200) | 87.34 | Score required to be called for Mains |
| Mains (1,750) | ~720–740 | Score required to be called for Personality Test |
| Final (Mains + Interview, 2025) | ~960–980 | Score required for final-list selection |
The Prelims cut-off determines who appears for Mains. The Final cut-off determines who joins service. The compounding effect: a Prelims-clearing aspirant has a roughly 3,000-call-letter chance vs Mains-cleared 1,000 vs final-list ~700-900. Each stage drops 2–3× of the previous pool.
For Mains-stage cut-off trends, see the UPSC CSE Mains 2026 — 80-Day Strategy which covers the post-Prelims preparation cycle.
Methodology and source notes
Where every cut-off in the table comes from:
-
2015–2024 Prelims cut-offs: official UPSC cut-off PDFs, released by UPSC after the Personality Test stage of each respective cycle. UPSC publishes a single document per year listing Prelims, Mains and Final cut-offs by category. These PDFs are archived on upsc.gov.in under the "Cut-offs" section.
-
2025 Prelims cut-offs: declared in August 2025 with the CSE 2025 Mains call list. Italicised band-figures in the table reflect the declared values; precise category-wise PDF is on upsc.gov.in.
-
2026 Prelims cut-offs: publish in July 2026 alongside the CSE 2026 Mains call list. This article will be updated with the verified figures within 24 hours of UPSC's release.
-
Vacancy figures: official notifications archived on upsc.gov.in for each cycle. Cross-checked against UPSC's Annual Report.
Where prior-cycle figures cannot be independently re-verified from the primary source today (e.g. specific PwBD subcategory numbers in cycles 2015–2018), the cell shows "—" rather than an estimated number. Resultpedia does not publish placeholder figures as if they were verified — that's the editorial-honesty standard described in the Editorial Policy.
Frequently asked questions
I'm projecting an OBC Prelims score of 78. Is that a clear or a miss for CSE 2026?
Why was 2023 such a low-cut-off year?
I keep seeing different "expected cut-off" numbers from different coaching institutes. Which one to trust?
Does the Prelims cut-off determine my Mains marks?
My calculated score after the 2026 answer key is exactly at the forecast cut-off. Should I start Mains prep now?
The UR cut-off has fluctuated 40 marks across the decade. What's a "safe" target?
Related reading from Resultpedia
- UPSC CSE 2026 — Pillar Page — Full cycle data + verified vacancy table
- UPSC CSE Prelims 2026 — 19-Day Revision Plan — Cluster slot #2: how to lift your Prelims score in the final stretch
- UPSC CSE Mains 2026 — 80-Day Strategy — Cluster slot #3: post-Prelims plan
- UPSC CSE 2024 vs 2025 vs 2026 — What Changed — Cluster slot #4: cycle-comparison context for the 933-vacancy figure
- IAS vs IPS vs IFS — Honestly Compared — Cluster slot #5: service preference logic
- /upsc-jobs/ — All UPSC notifications hub
Vishal Thakur covers central government recruitment — UPSC CSE, SSC CGL, GD, MTS — for Resultpedia. He has been tracking UPSC CSE cycles since 2018 and maintains Resultpedia's cut-off database. Read his full bio → · Subscribe to his RSS feed →
Disclaimer: Resultpedia is an independent editorial portal. We are not affiliated with the Union Public Service Commission. Cut-off figures in this article trace to official UPSC cut-off PDFs published after each cycle's Personality Test stage. CSE 2025 figures are sourced from the August 2025 UPSC release; CSE 2026 figures are awaited and will be updated within 24 hours of the official release expected in July 2026. Forecast figures are illustrative; aspirants should treat them as planning bands, not as the actual cut-off, until UPSC publishes the verified document. Always verify on upsc.gov.in before relying on any single source. See our full Editorial Policy and Correction Policy.